Analytics Dashboard
THE PROJECT
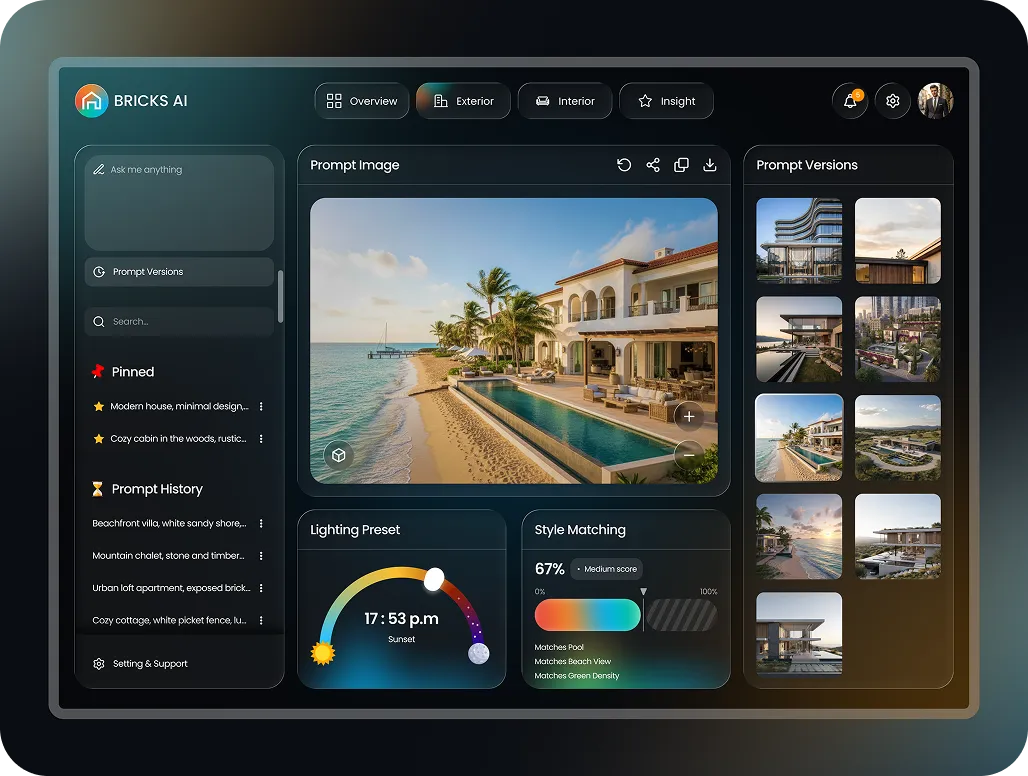
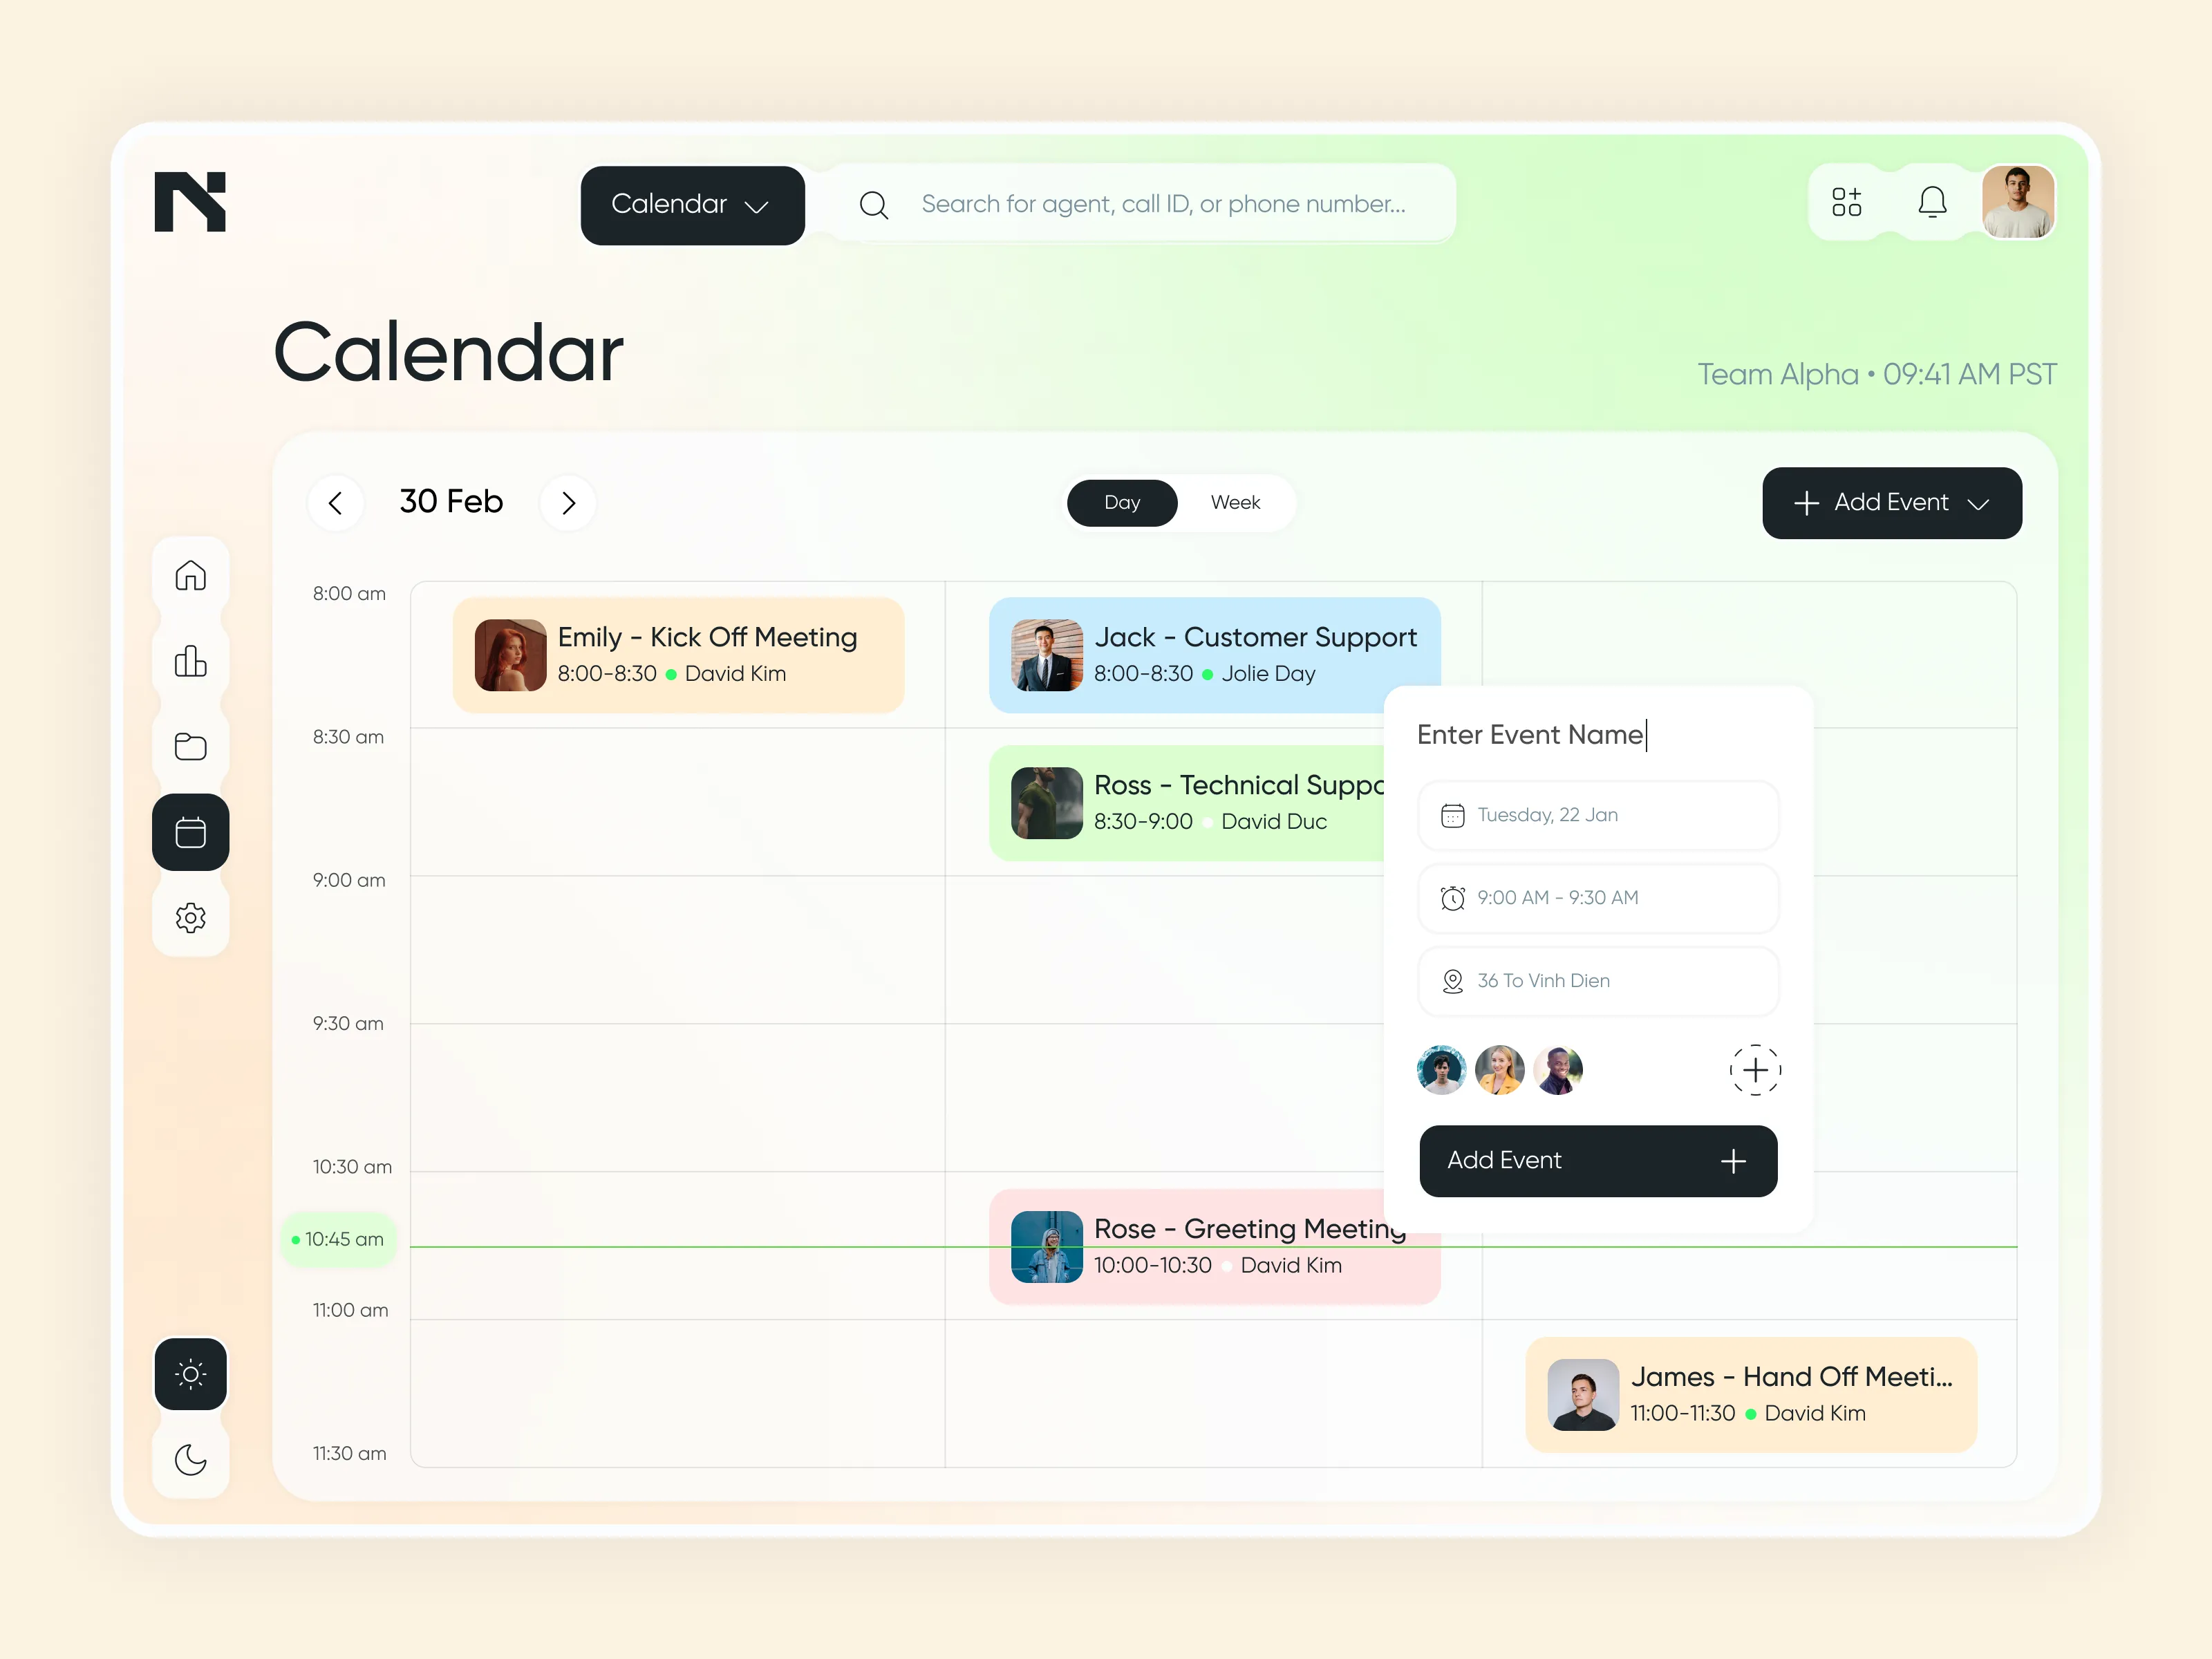
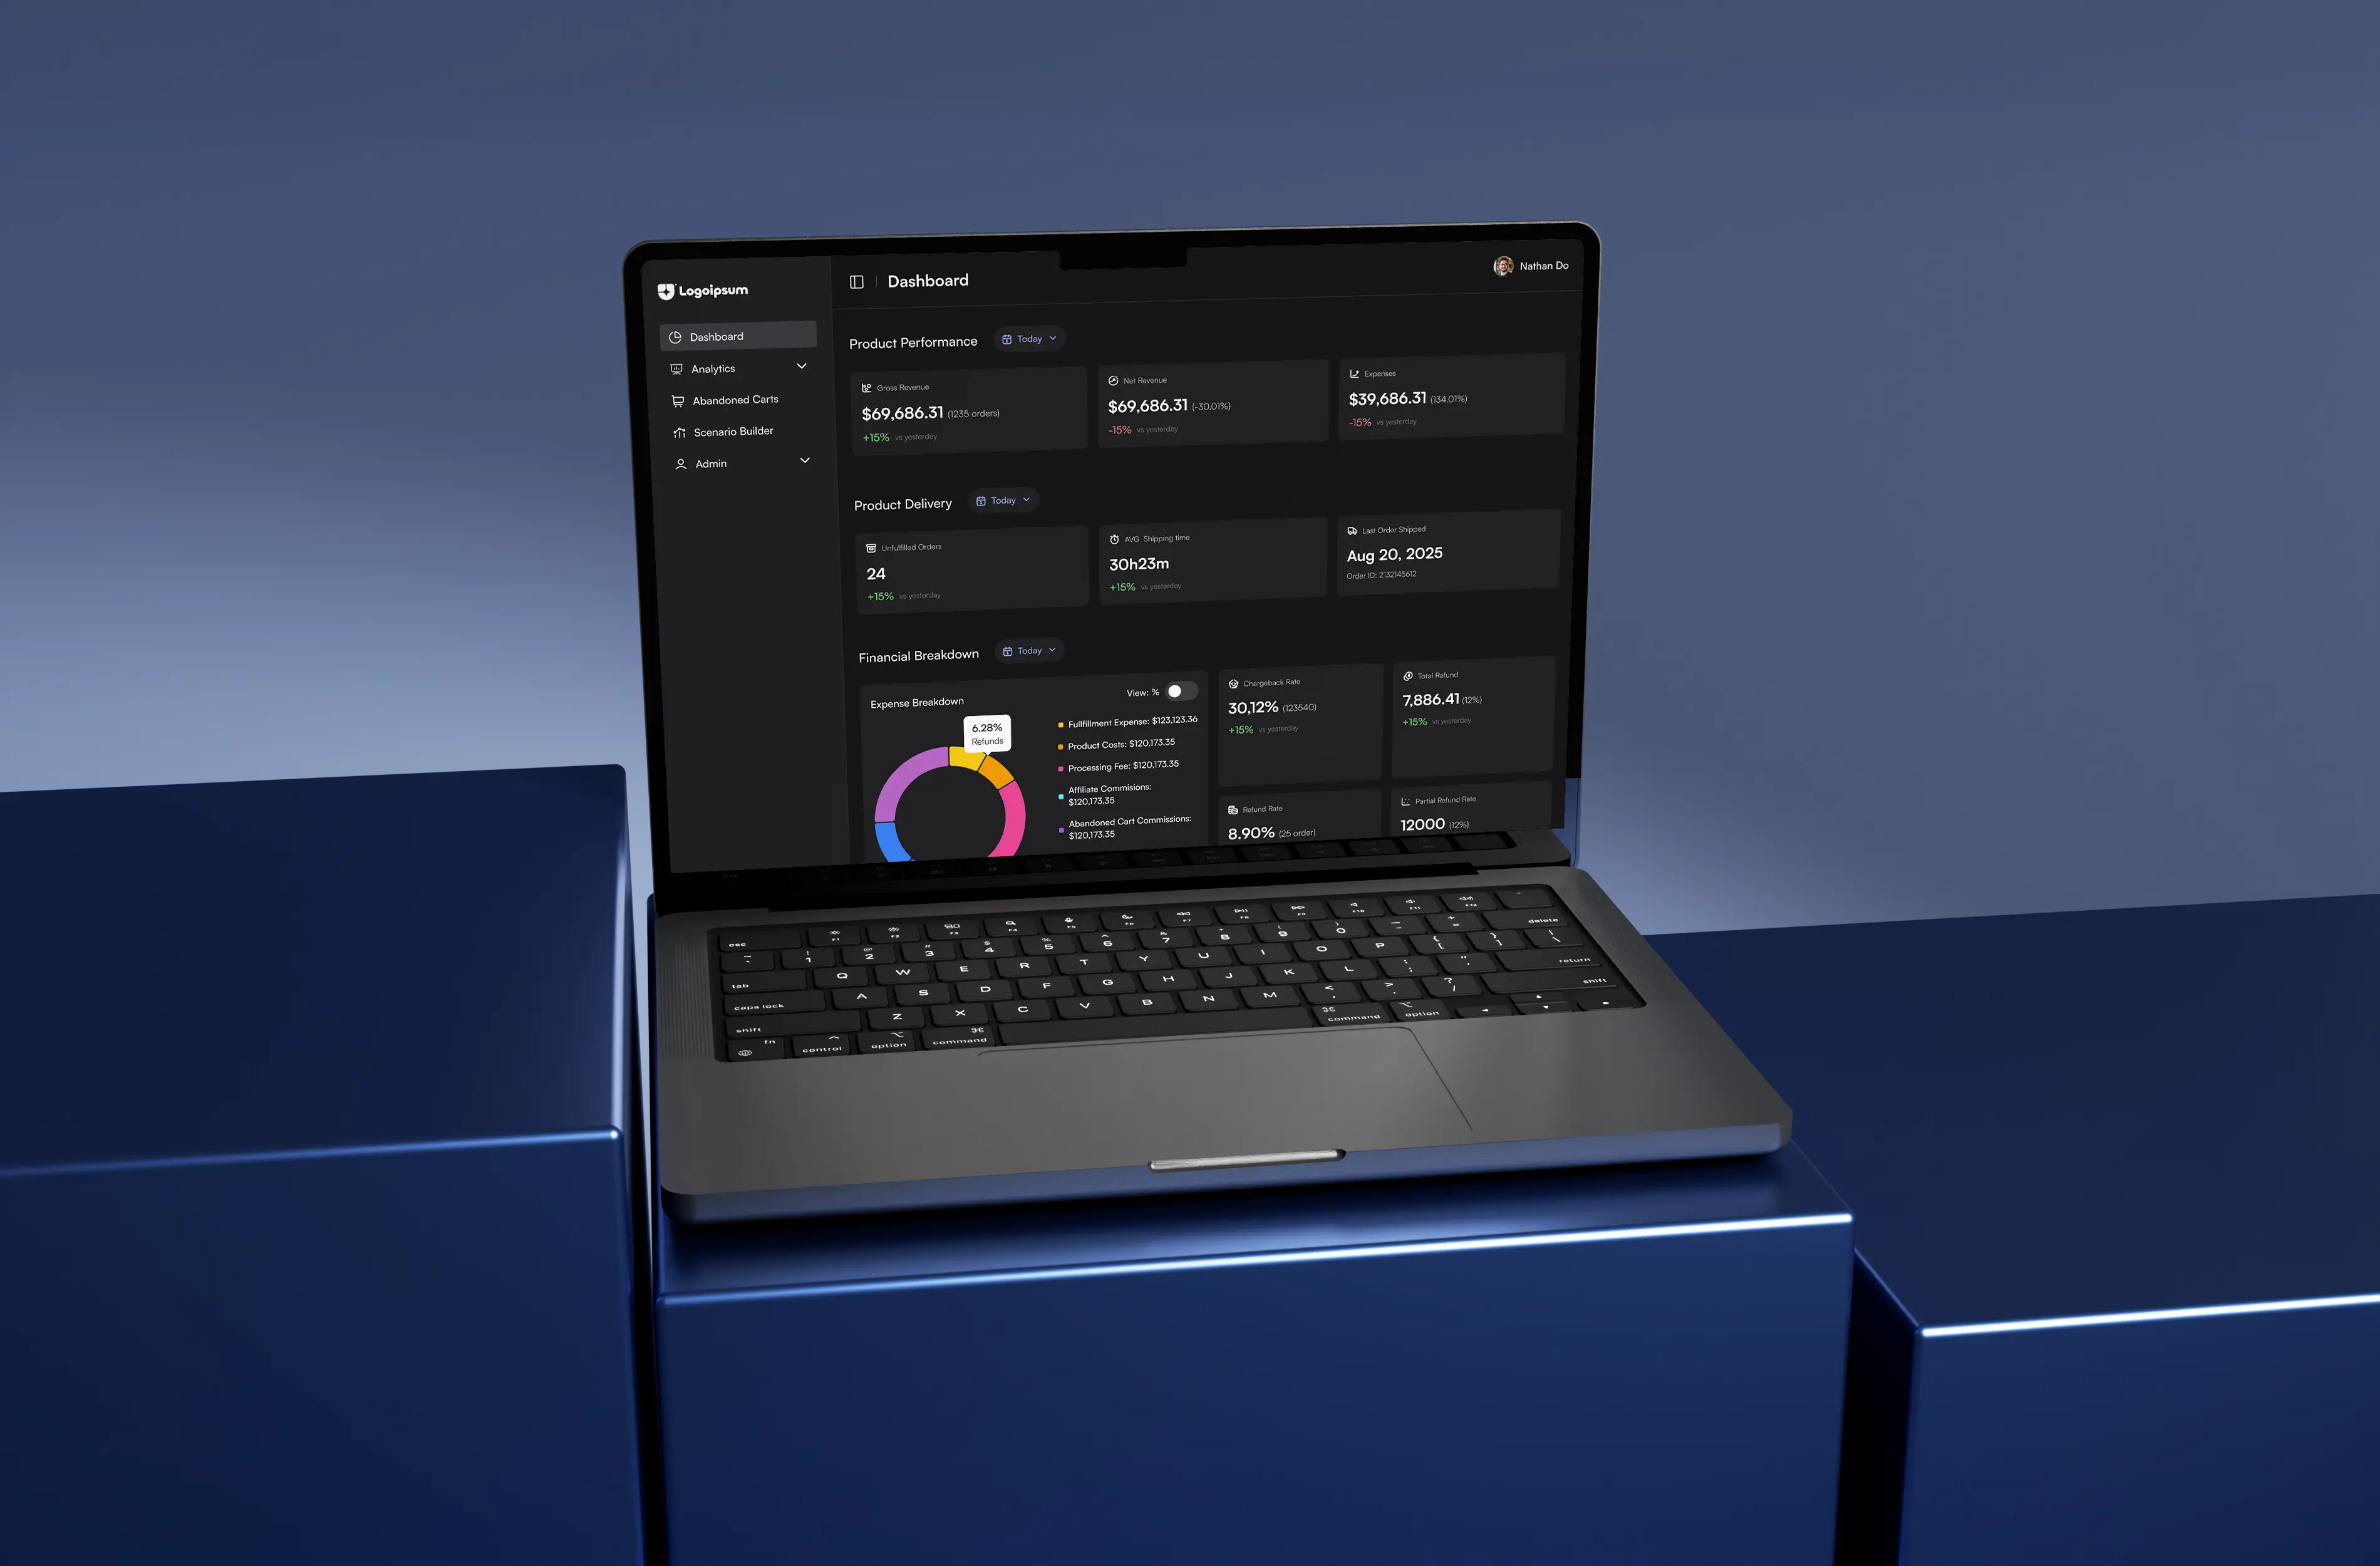
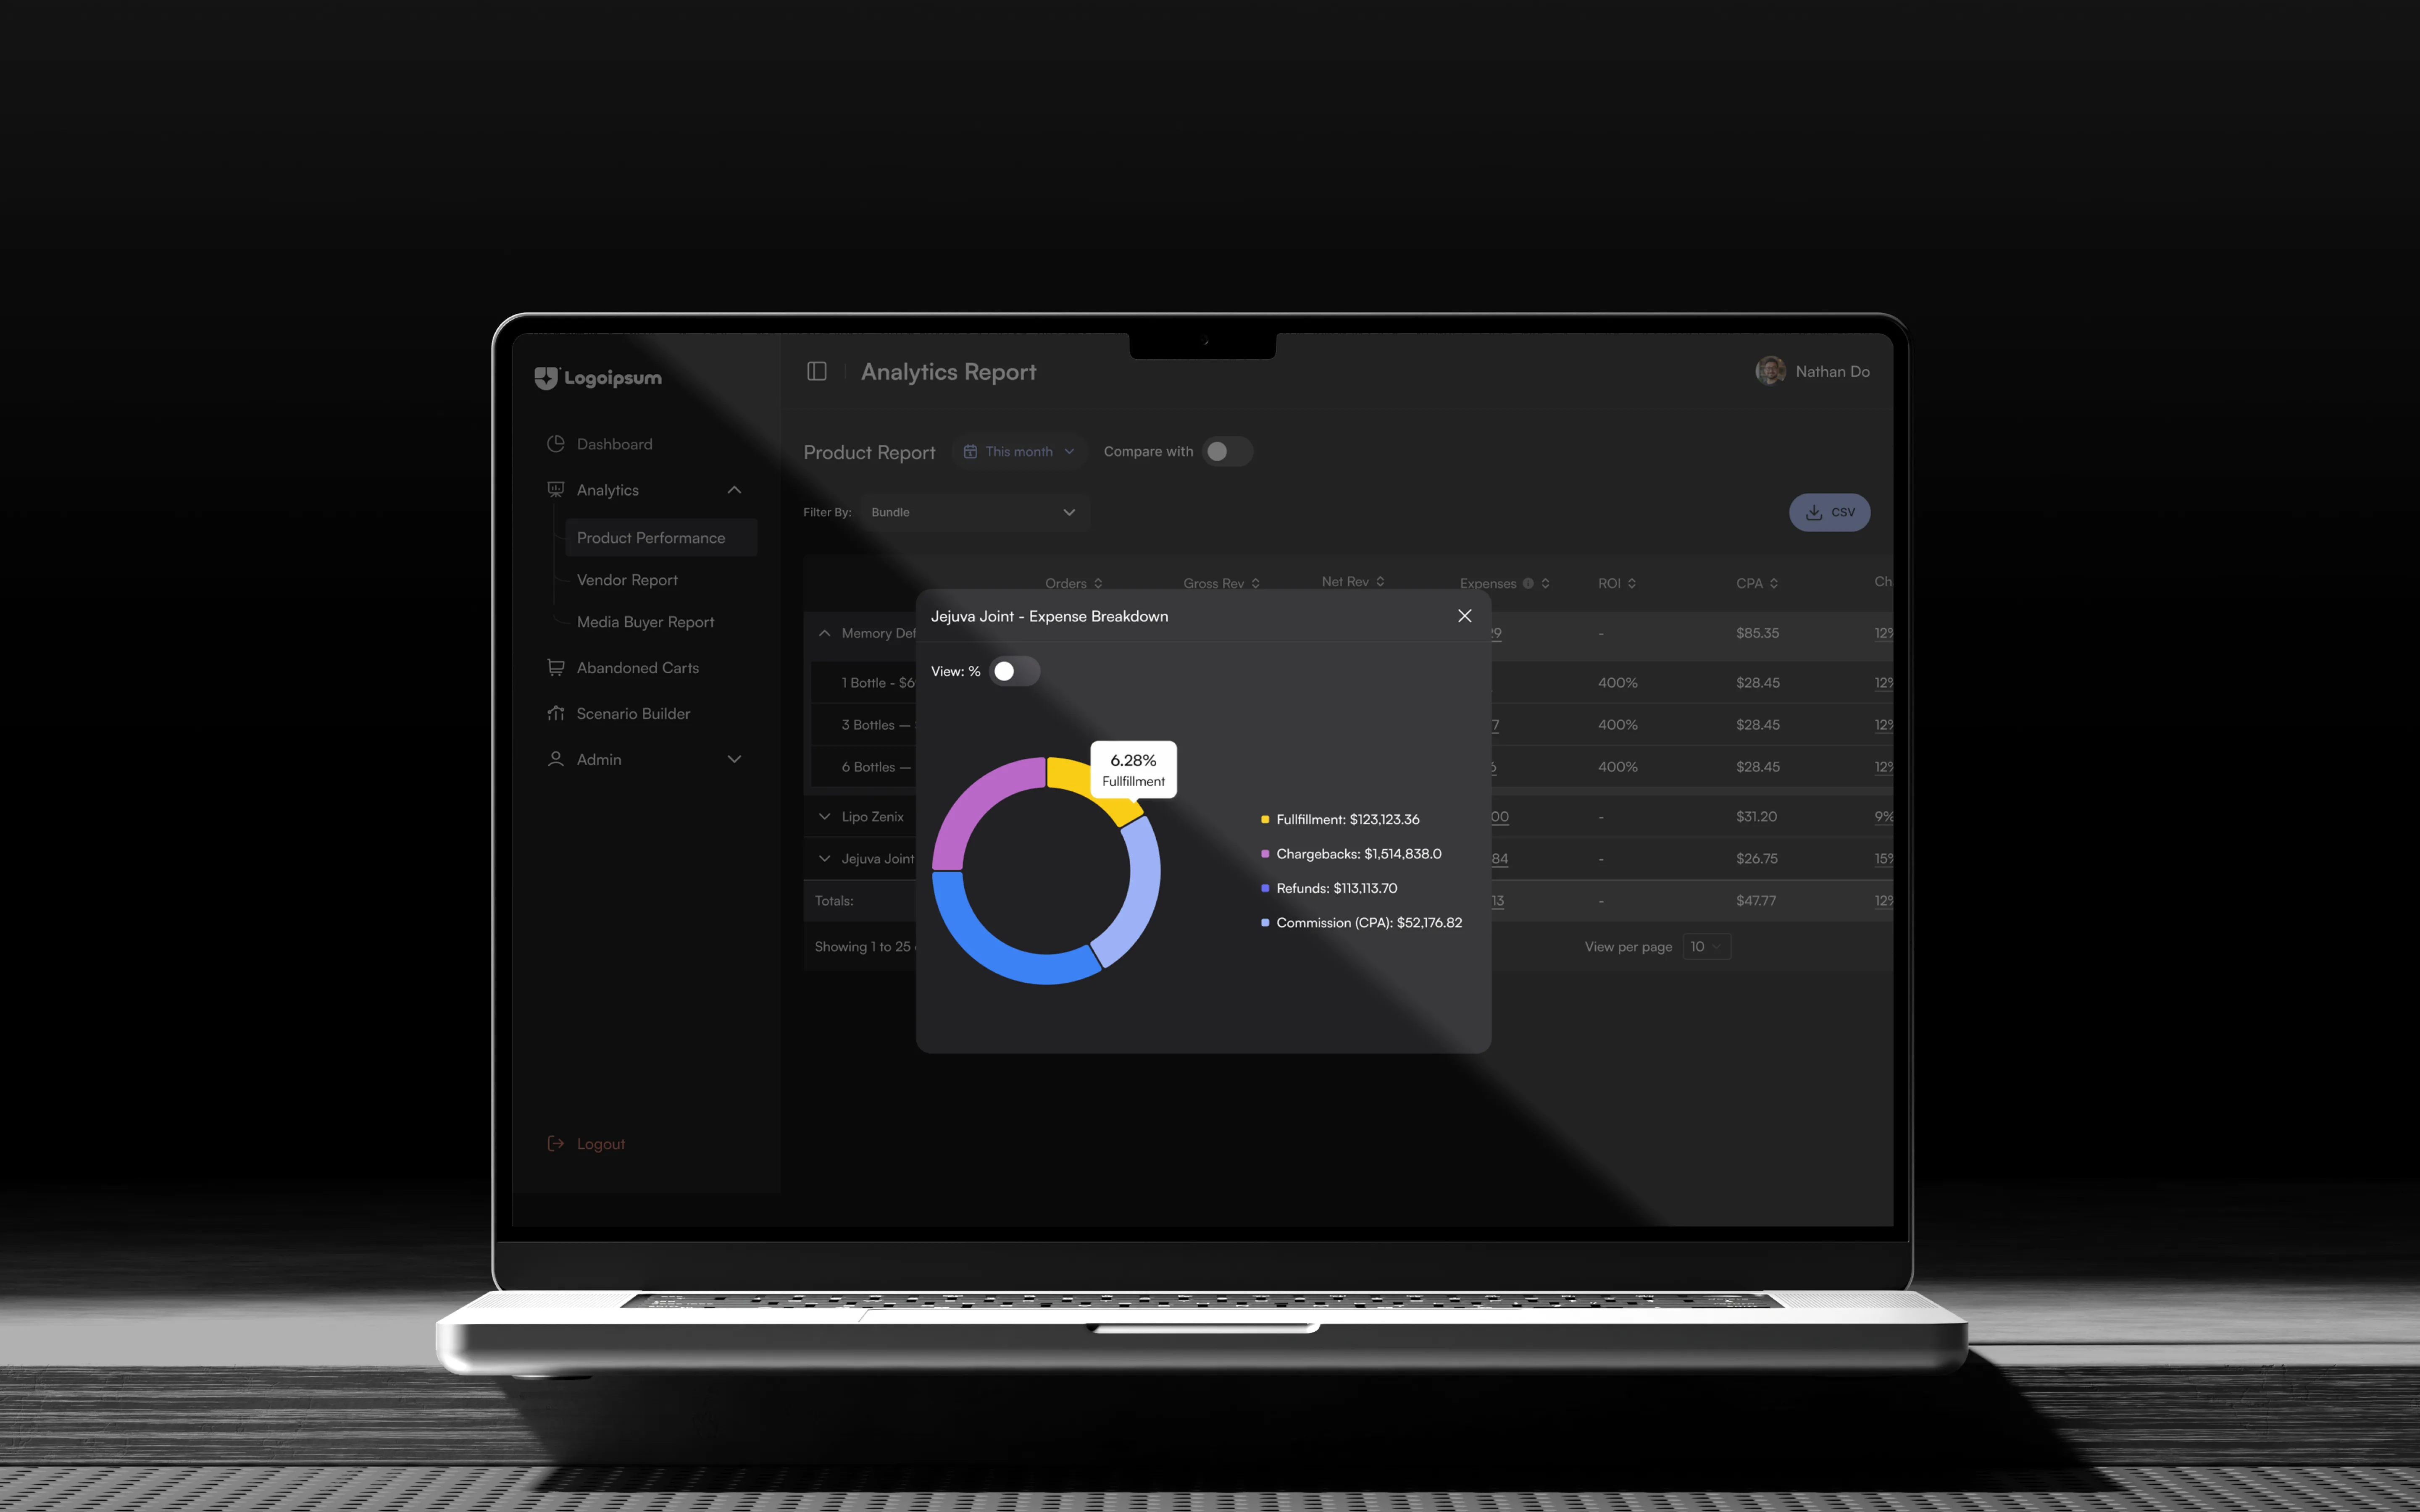
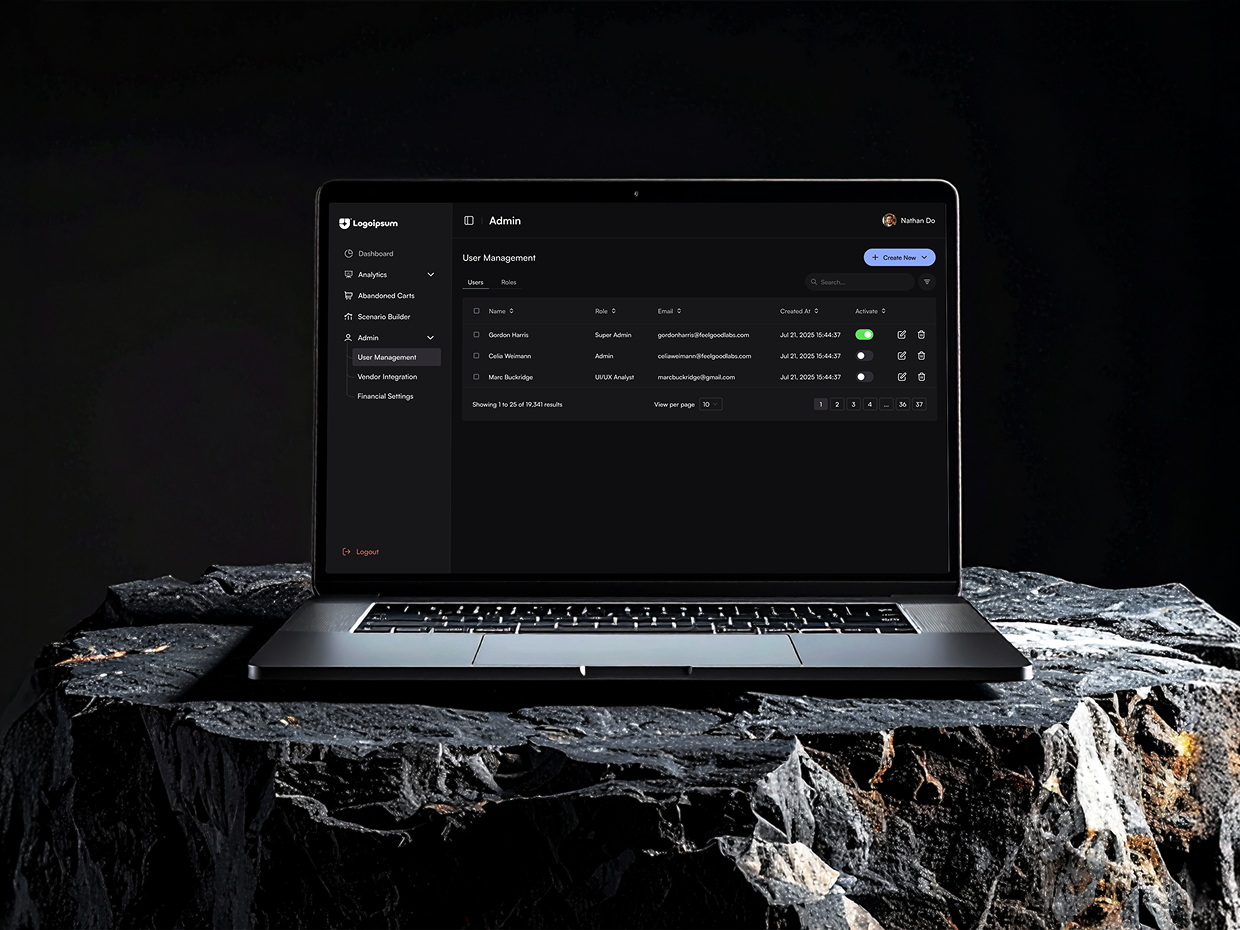
A responsive analytics dashboard (mobile & desktop) built for an e-commerce business in the health & beauty sector.
PROBLEM
Fragmented data: Performance data was scattered across products and categories, with no central view.
Hard to assess quickly: There was no easy way to see key metrics like revenue, orders, and refund rate at a glance.
Limited analysis: Users had no straightforward way to drill down or compare performance across dimensions.

GOAL
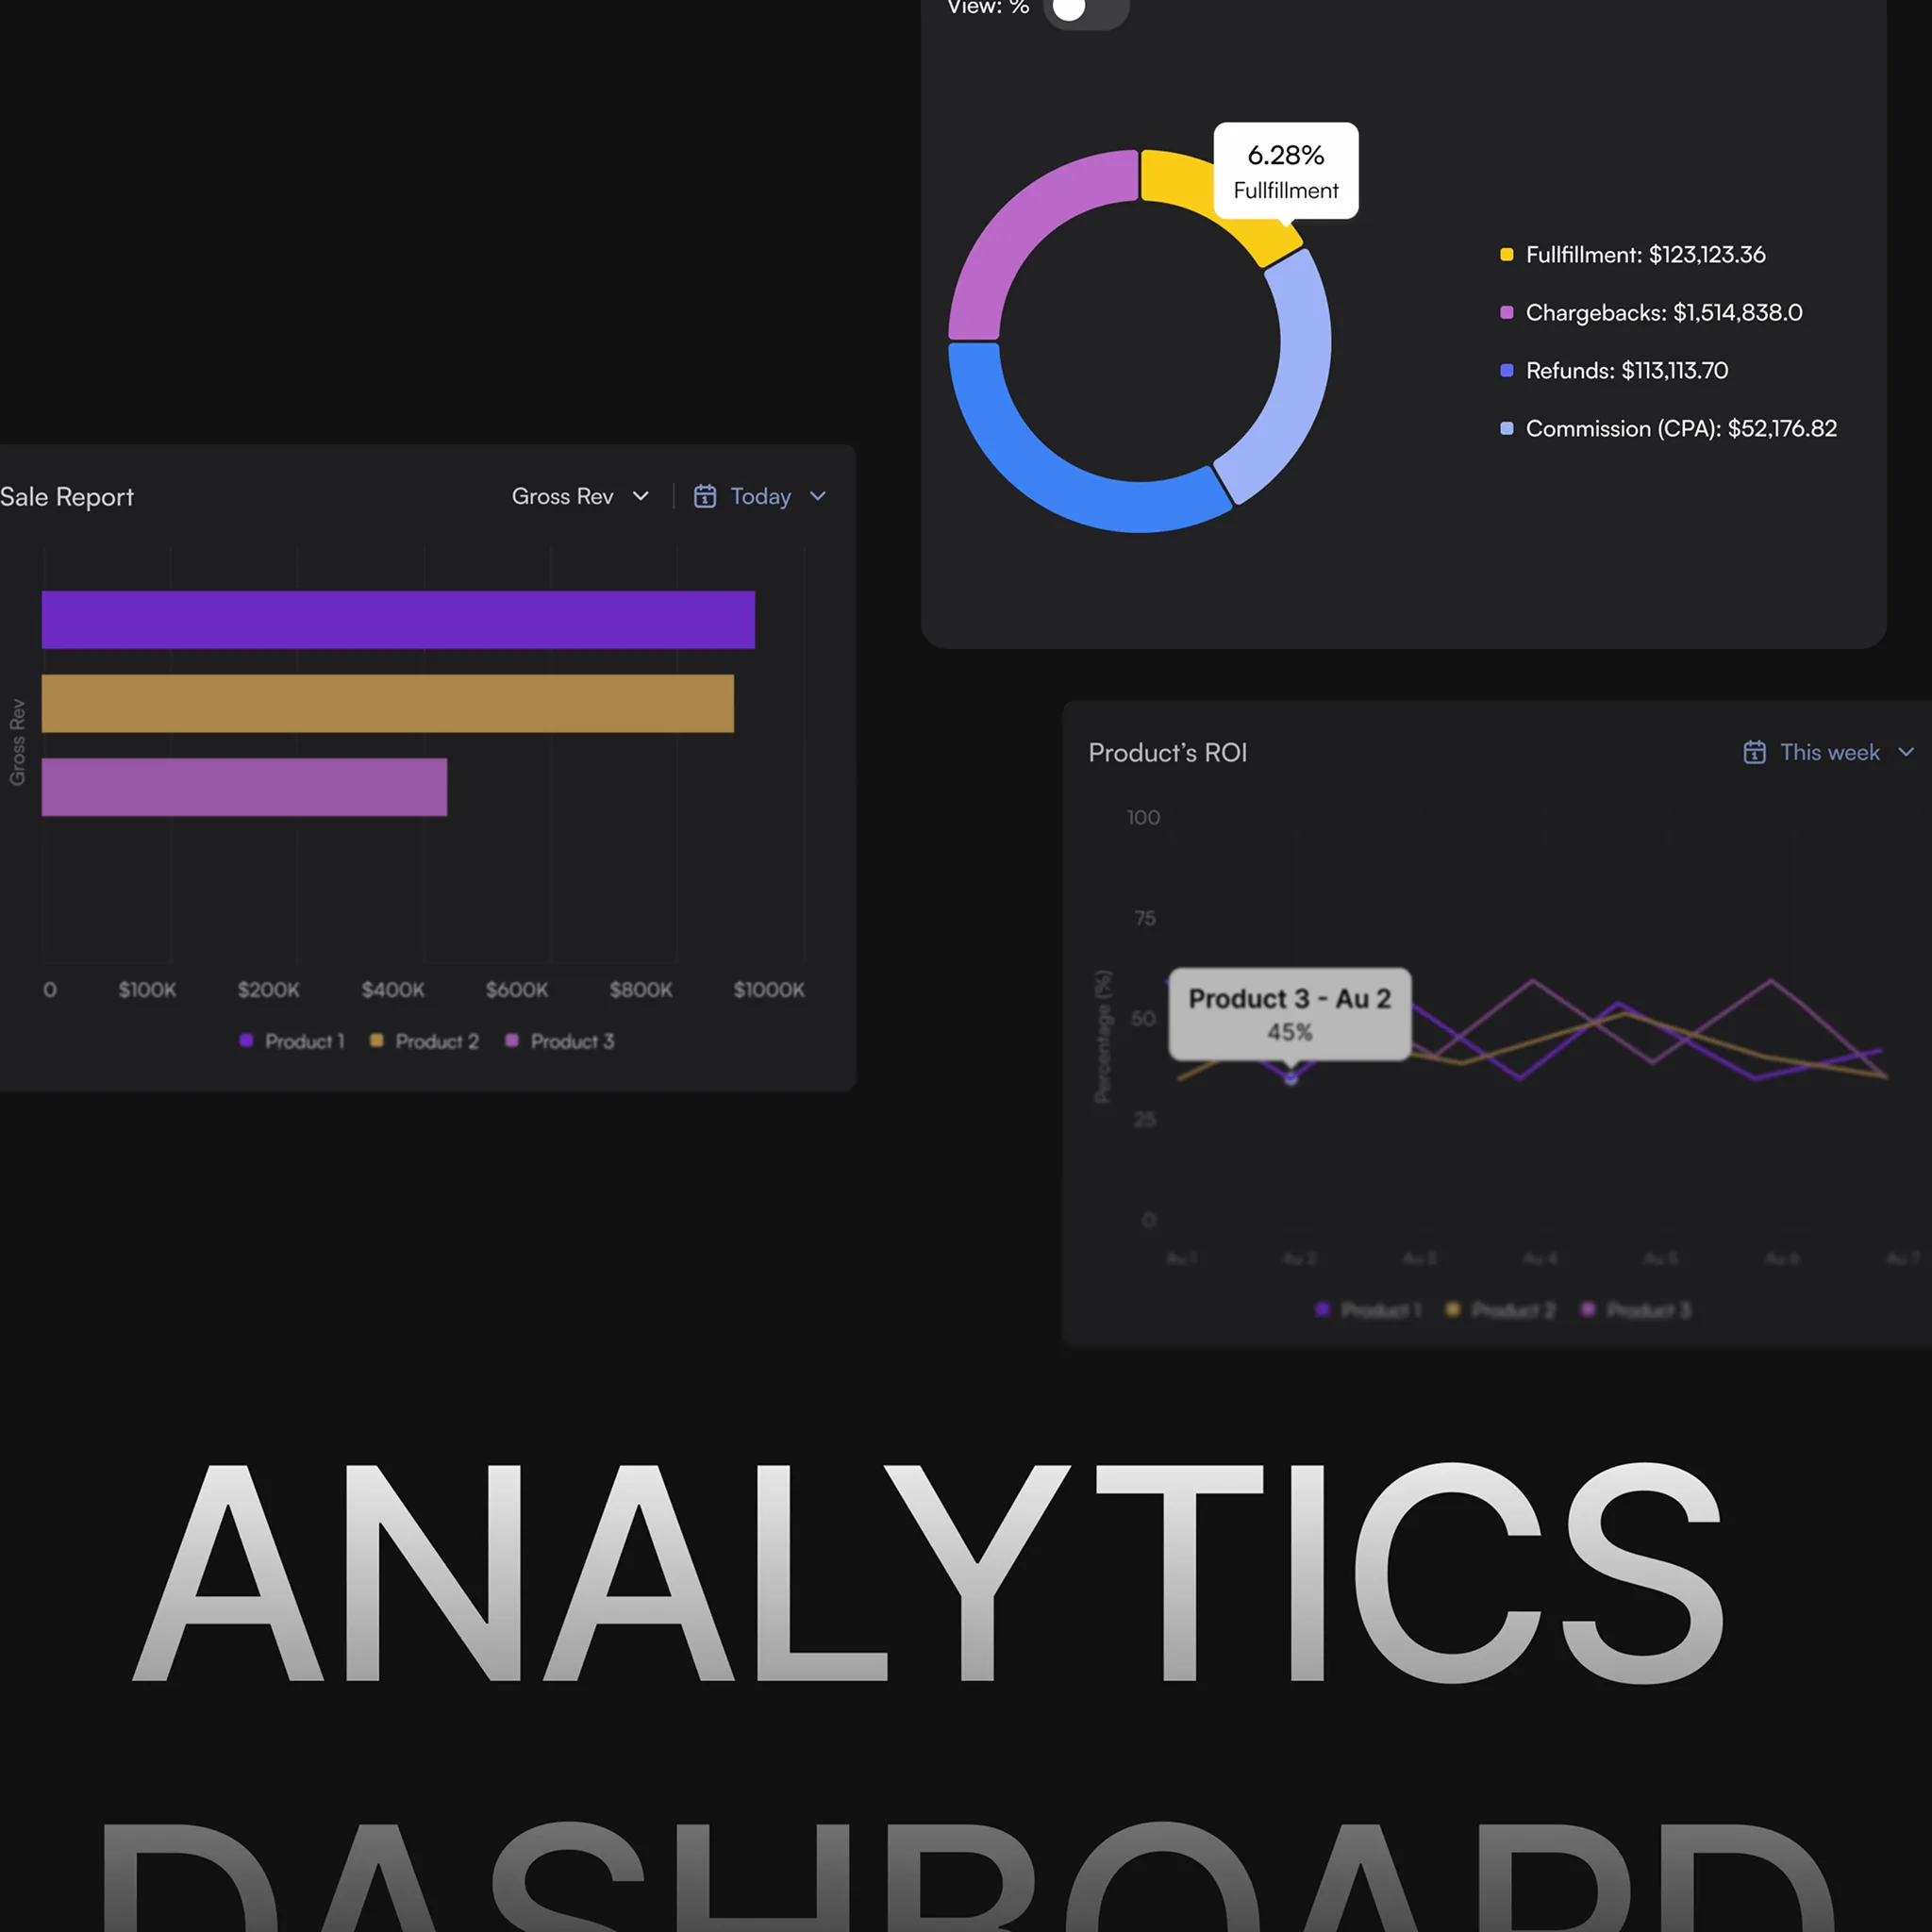
Design a responsive dashboard that delivers a clear performance overview alongside robust reporting — so users can monitor key metrics, drill into detail, and compare performance across dimensions for faster, data-driven decisions.

APPROACH
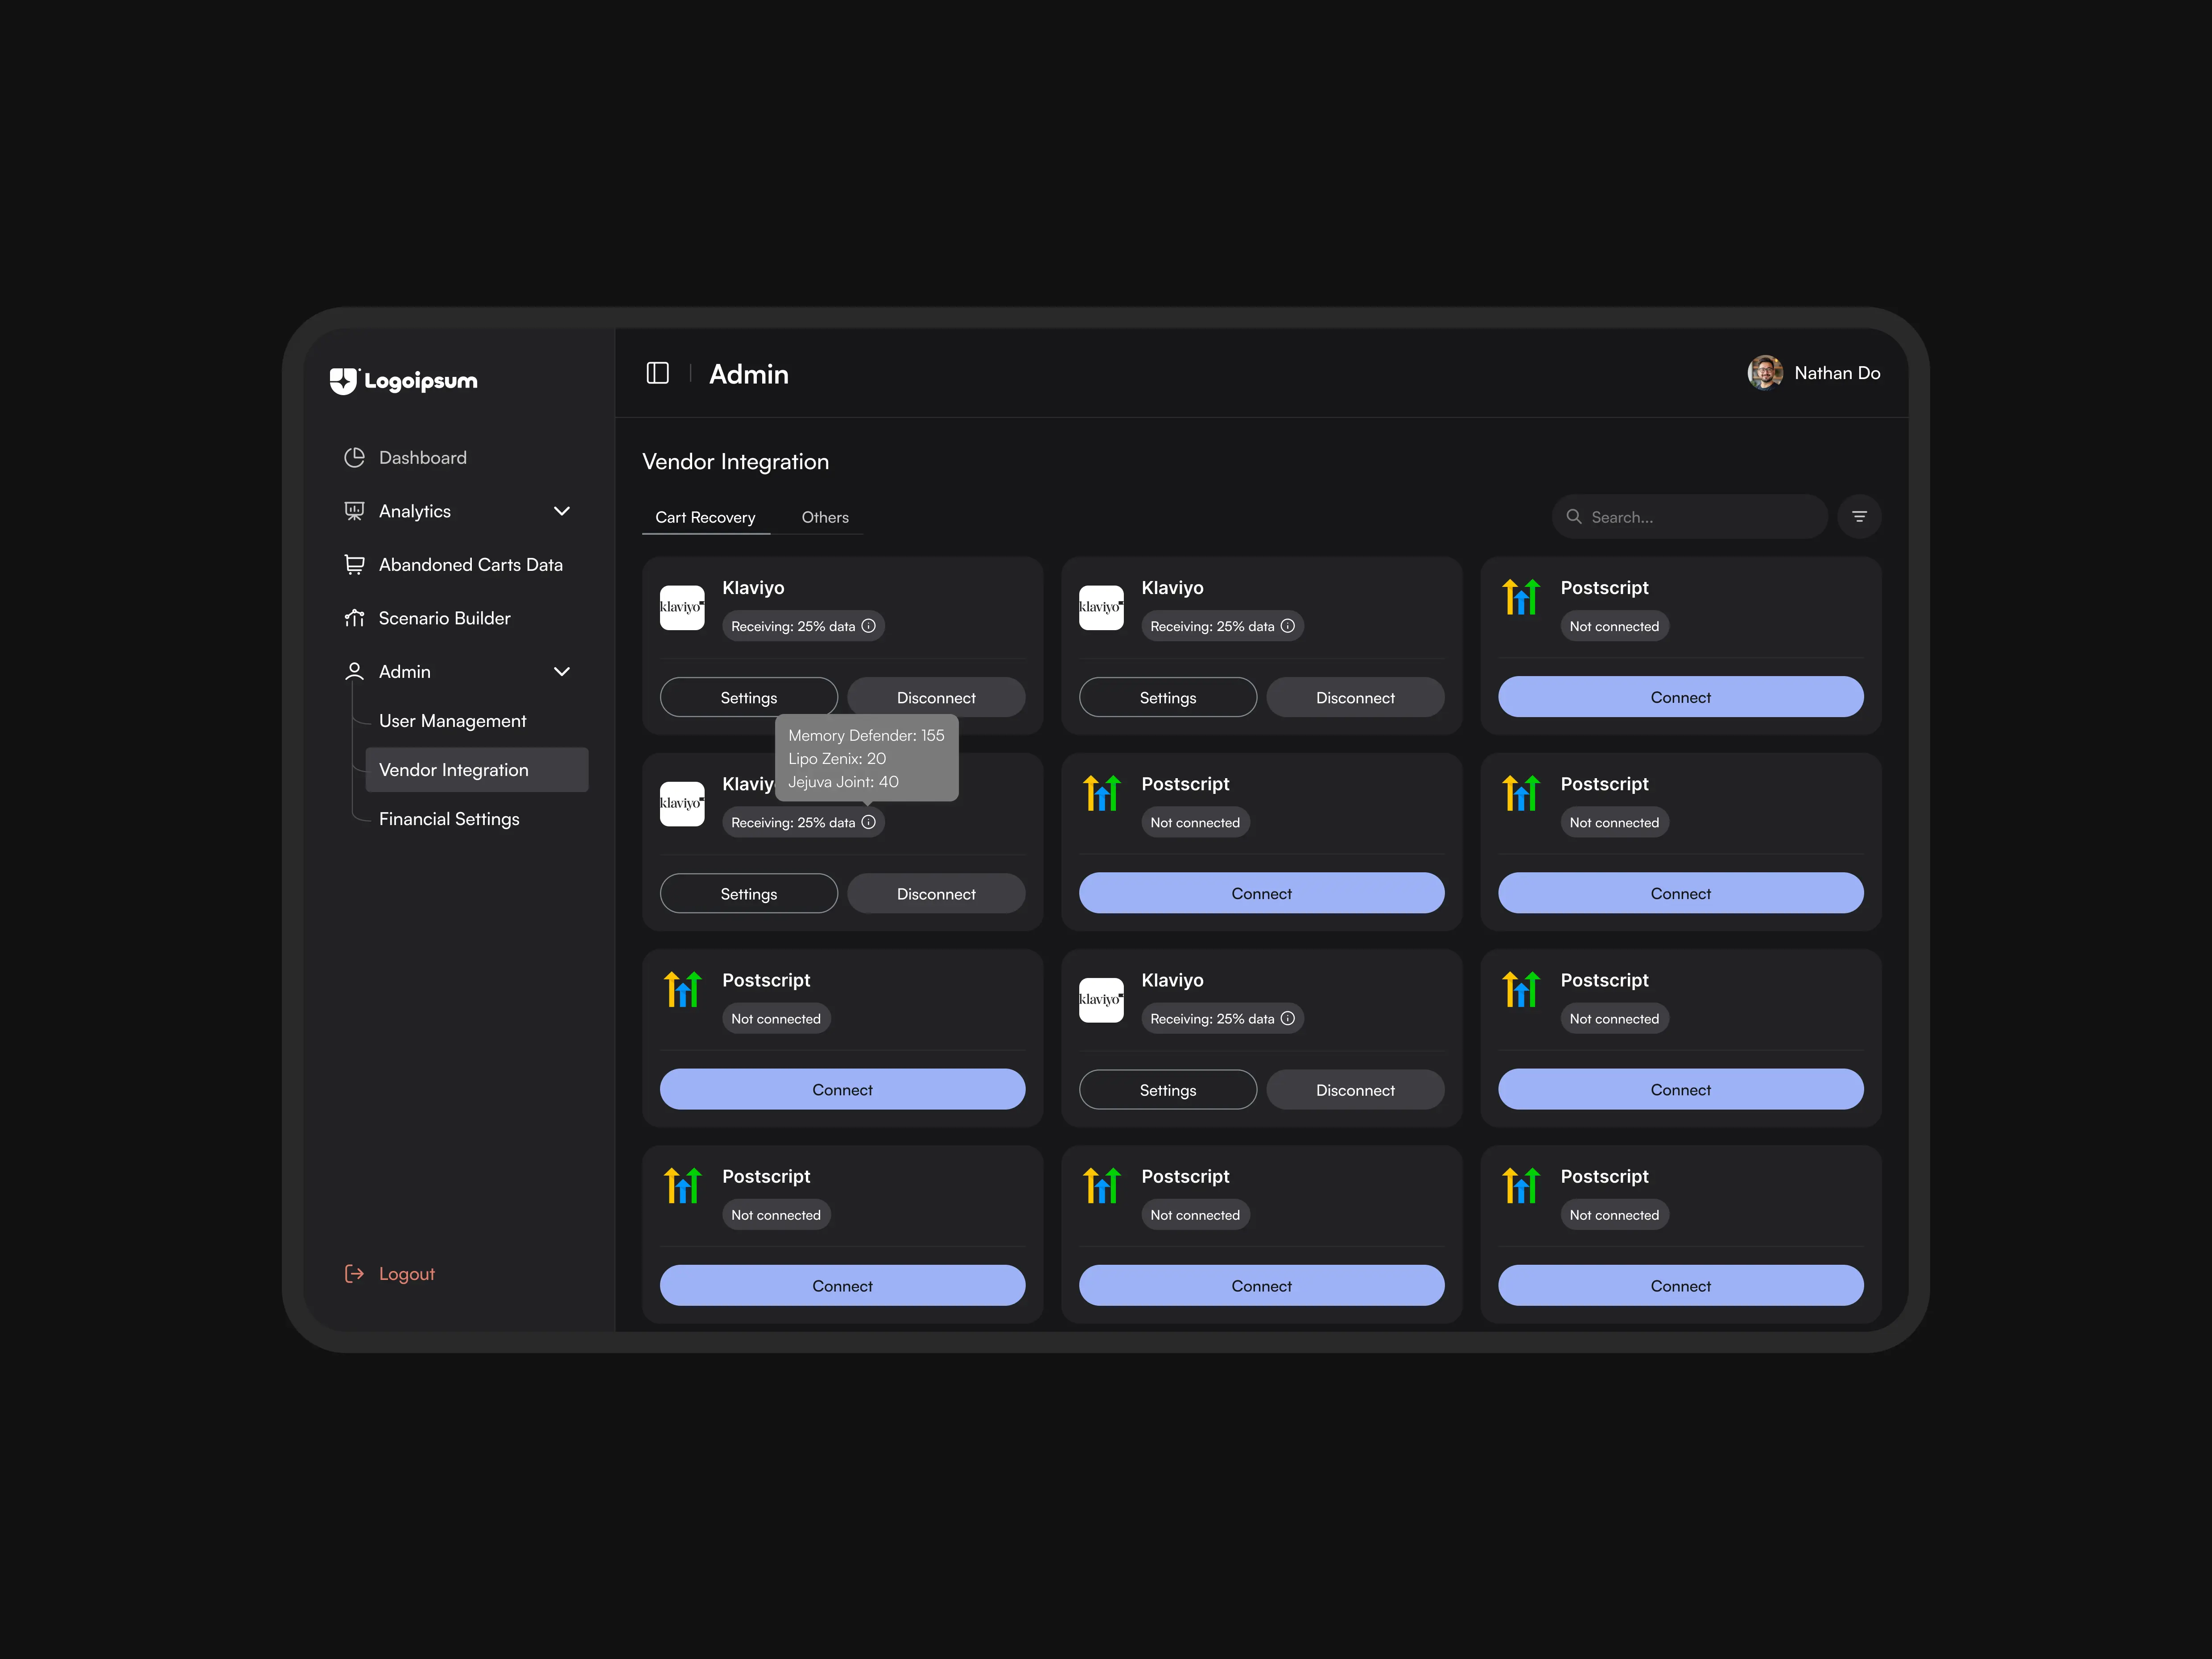
After brief onboarding and flow diagramming, we defined the visual direction and style guidelines before building the UI, delivered via Figma. The final structure uses sidebar navigation and top filters, with a KPI summary up top and charts/reports below for quick analysis and drill-down.

to Solve the Challenge
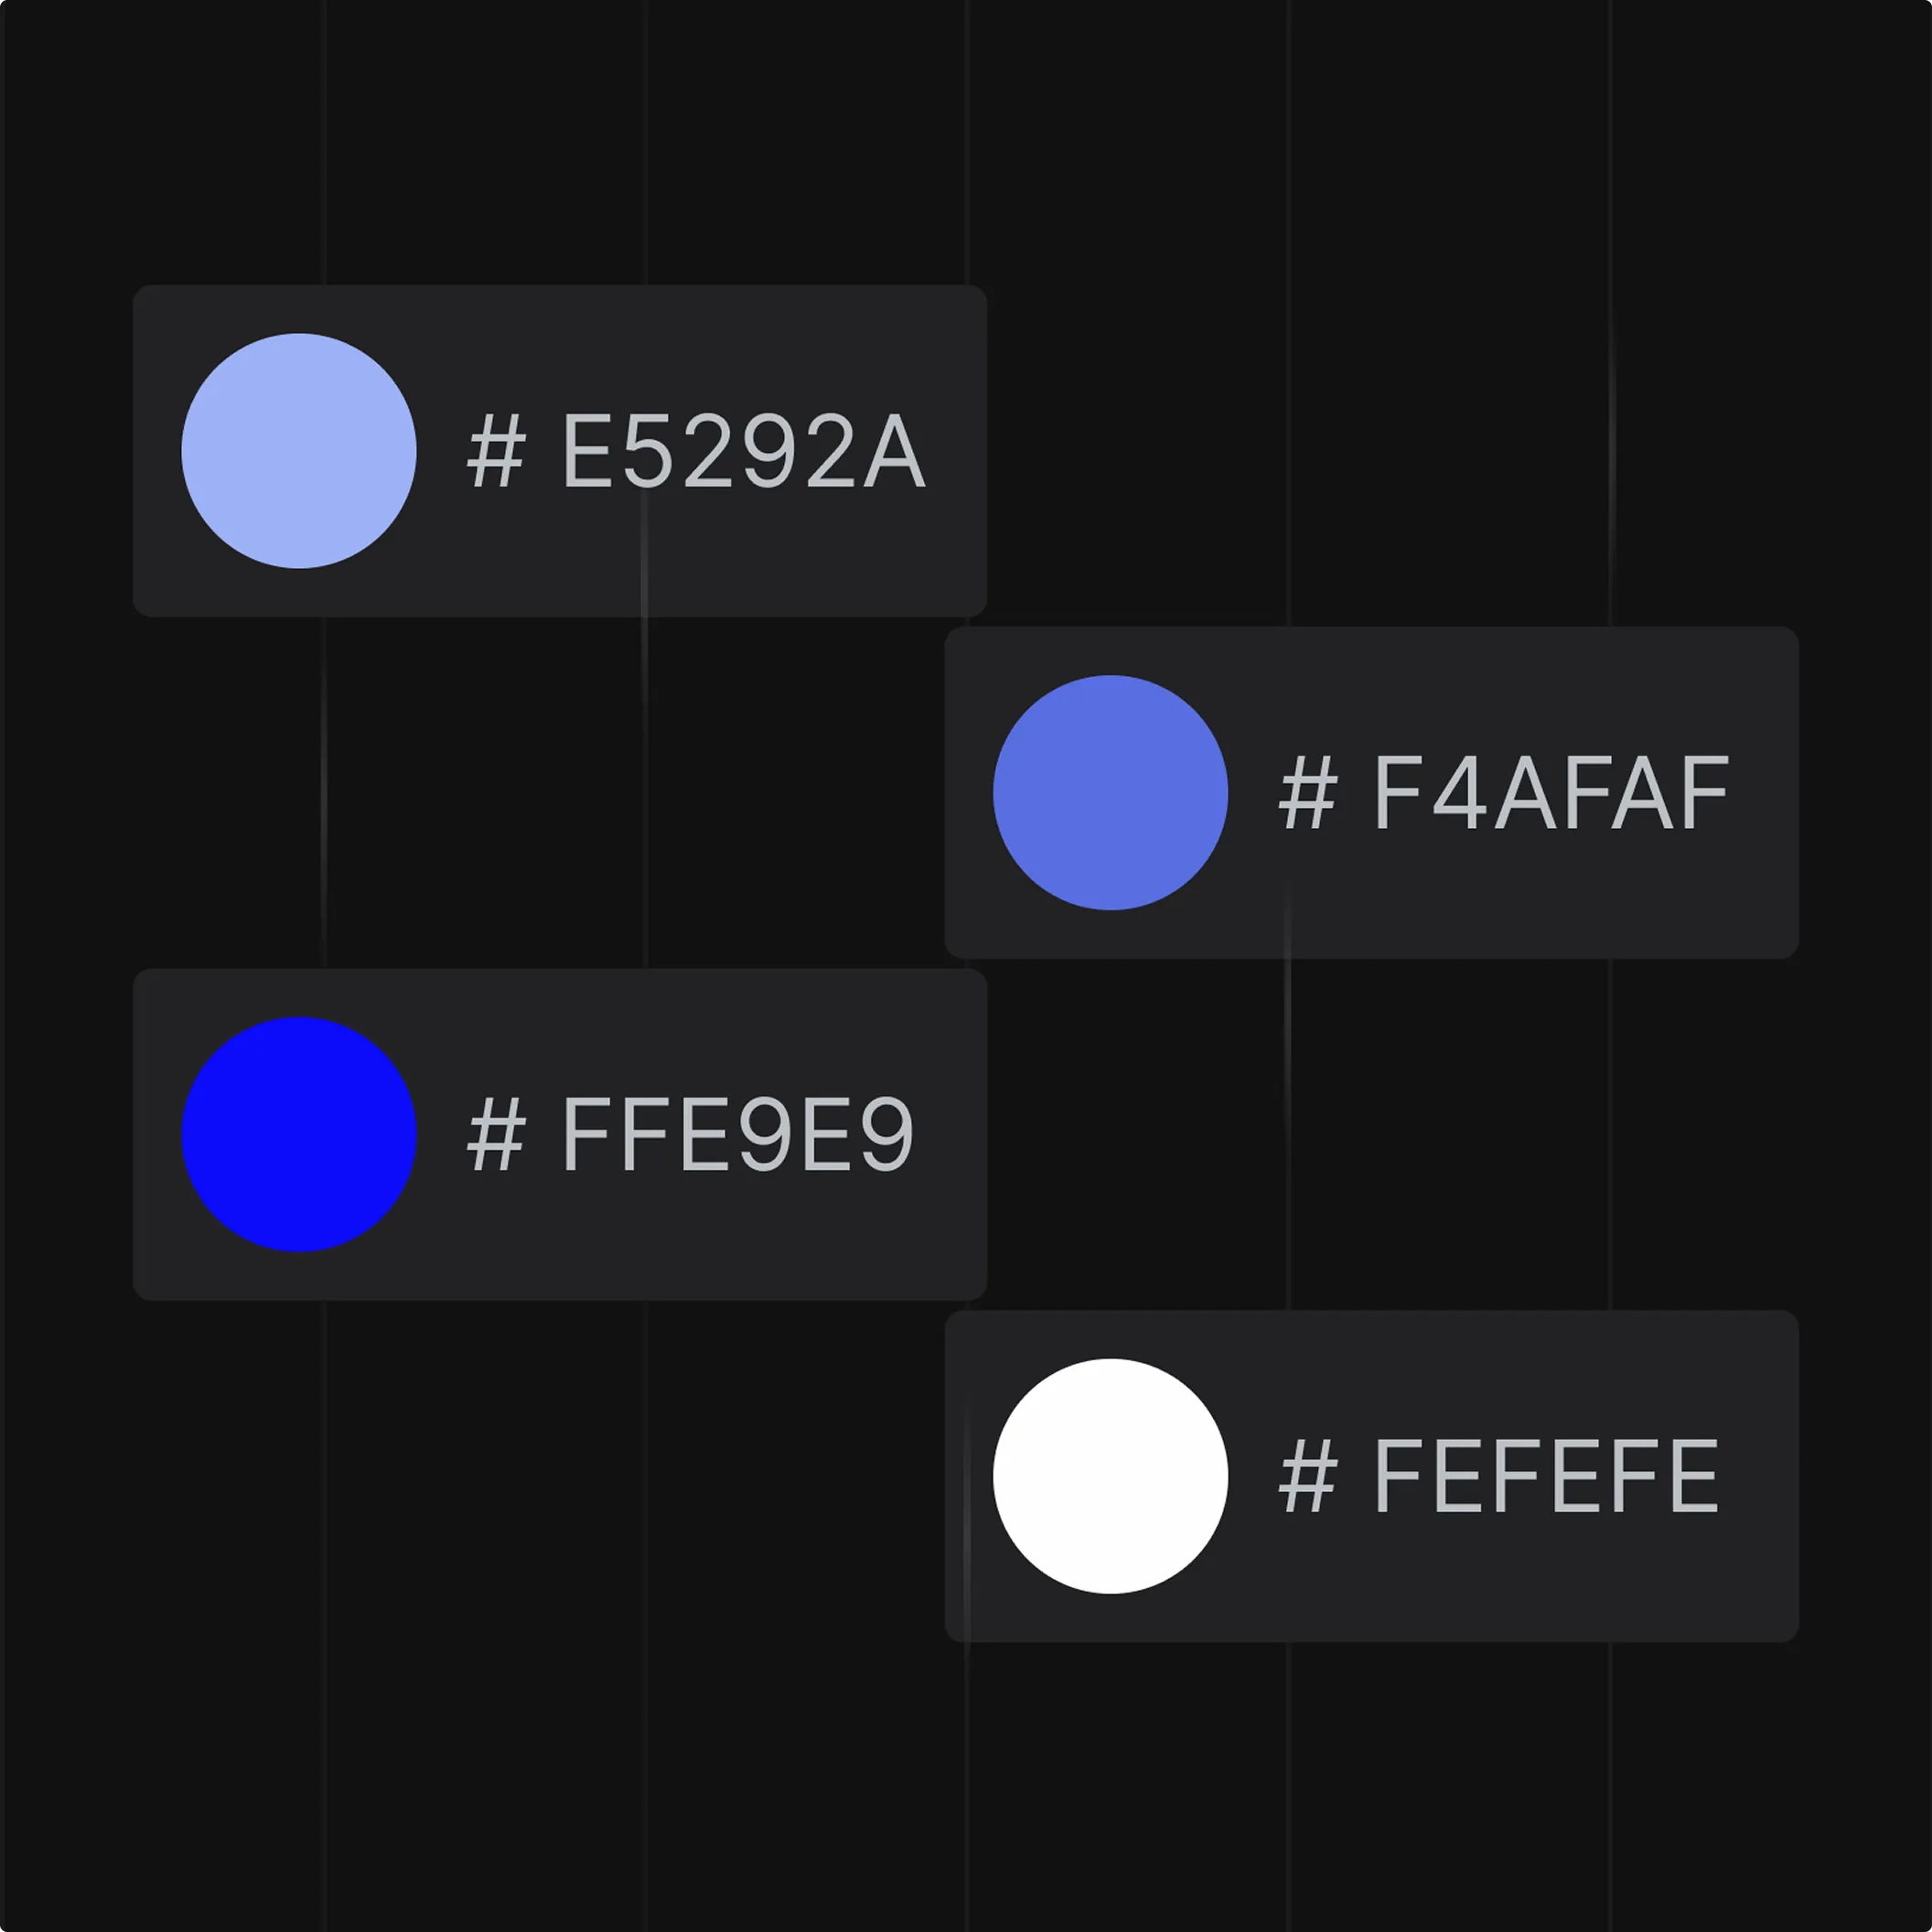
Design System
Without a system, every change takes longer — this brings speed and clarity back.

.webp)
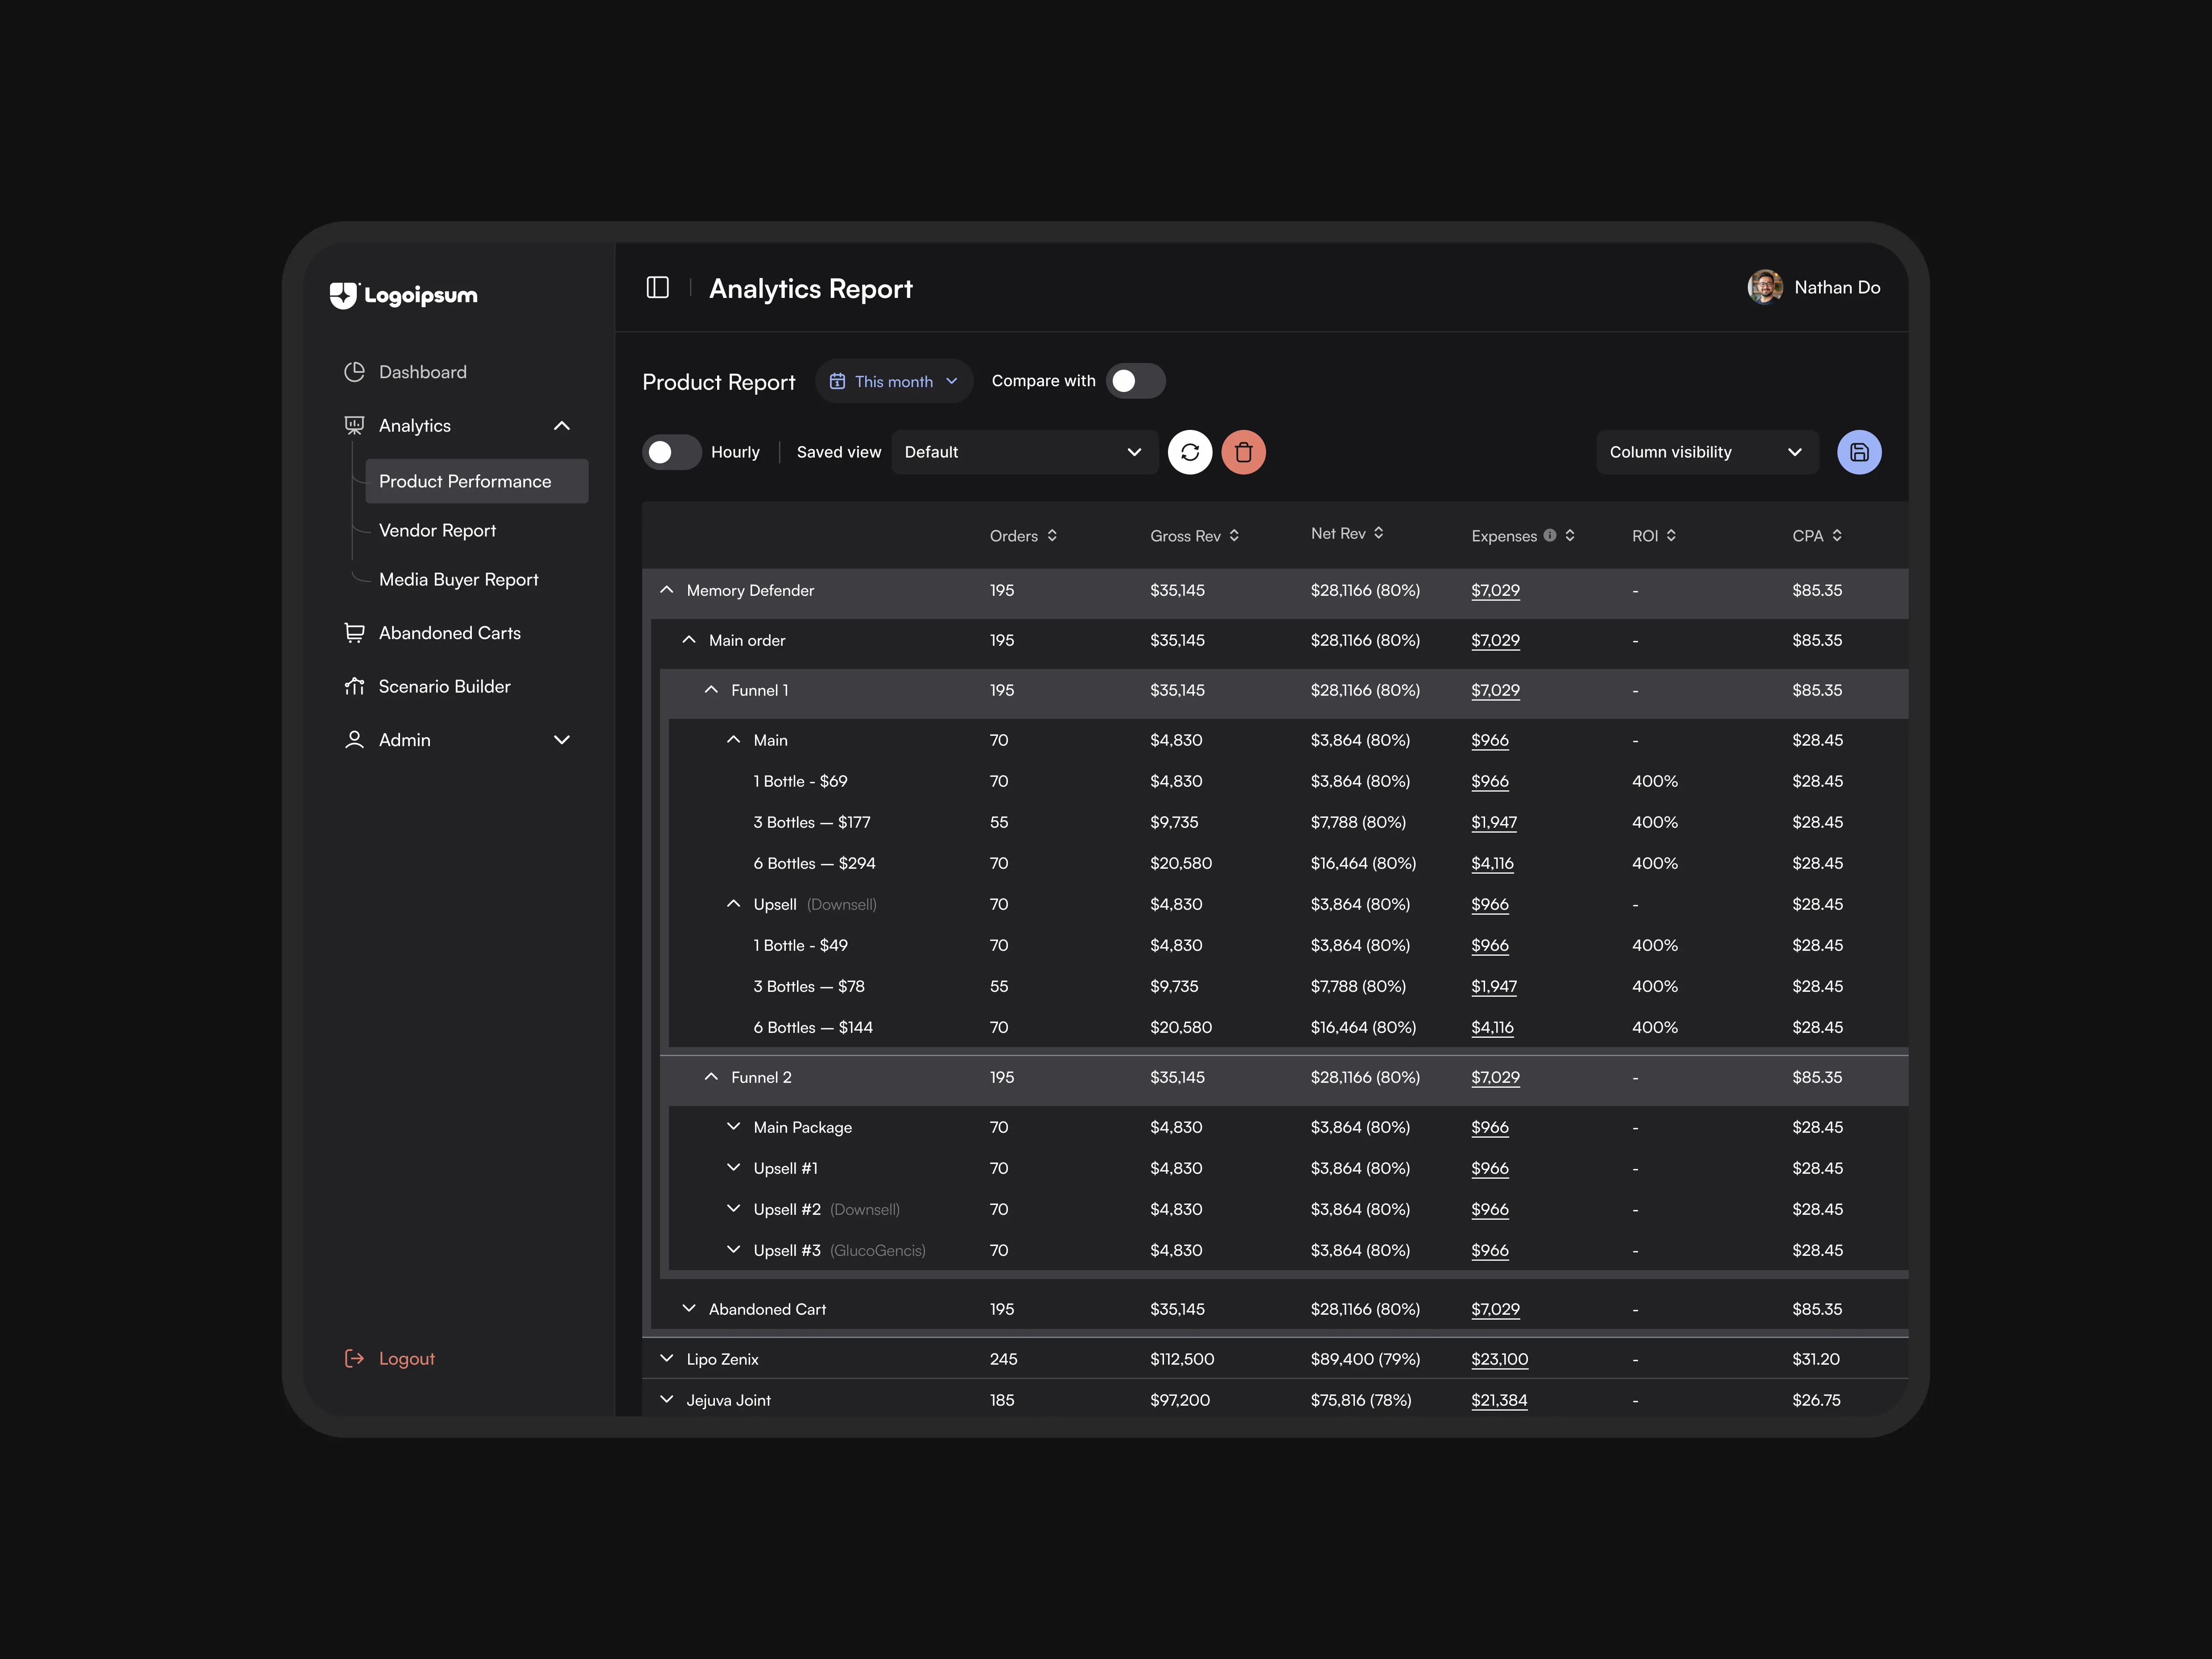
Dashboard layout
Structured layout with sidebar navigation, top filters, KPI summary on top, and charts/reports below for quick analysis and drill-down.
.webp)
IMPACT & OUTCOME
~30%
faster time-to-insight from a KPI-first layout
~25%
Reduction in time spent reconciling data across categories
Consistent experiences
Lets managers check performance from anywhere.
Built-in comparison
Tools make spotting trends and making decisions faster..





Let us
GROW
.webp)
your

business!